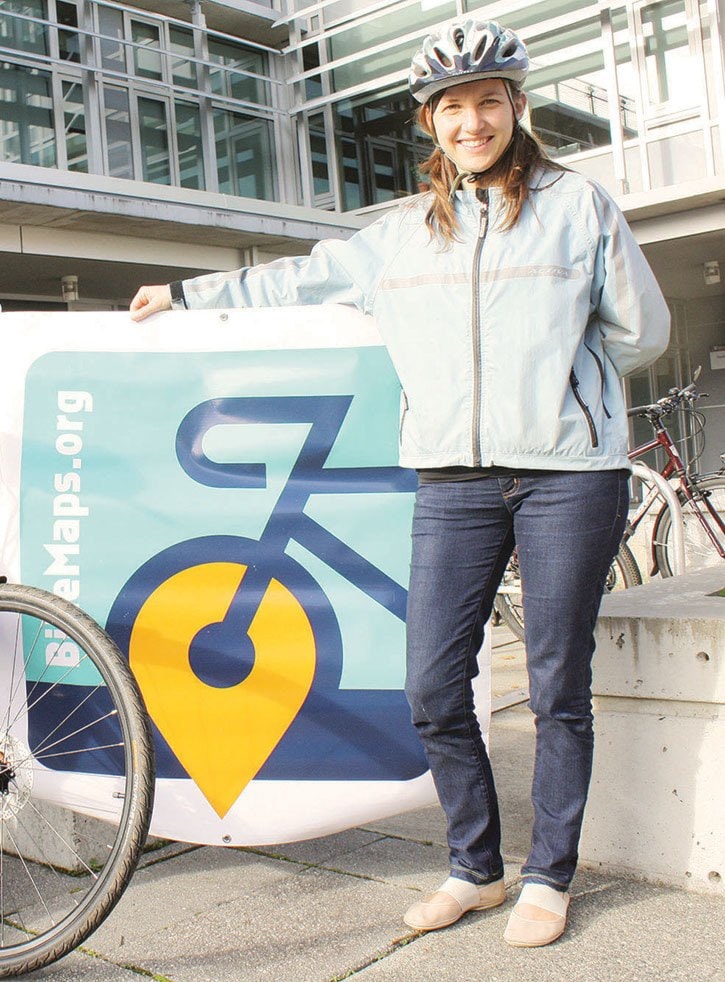
By Trisalyn Nelson, UVic Geography Professor, creator of BikeMaps.org
At the end of the turkey and shortbread season, I was desperate to hop on my bike and ride my commute to work.
Sure, we did a bit of cycling with the kids, but there is something about my commute that is particularly freeing.
I am a working mom and my kids are three and six years old. My commute is the only time of day that no one can talk to me!
(As I write this I can hear my three-year-old yelling that she needs warmer pajamas!)
Riding my bike is one of my few daily activities that actually reduces my stress. It is good for me, good for the environment, and makes financial sense.
I love bikes and maps and I had been pondering a way to incorporate these two passions for a while.
On a commute home I got the idea for a citizen mapping website, which I planned to call “flip the bird.”
My initial idea was to build a website where cyclists could humorously vent about bad interactions with vehicles, other bikes, pedestrian, and, yes, urban deer.
I started planning the project and I quickly realized it wasn’t funny. The available data on cycling safety is abysmal.
In the CRD it is estimated that only 30 per cent of cycling crashes are recorded through official reports, that is those that are made when police are called to a crash or through ICBC claims.
From 2009 to 2013 between 119 and 140 vehicle insurance claims involving bikes were made.
There is a lot going on for cyclists that we don’t know about, officially. Though the data aren’t compiled, as individuals we know the problem areas.
I ride almost every day and usually I feel quite safe, but I also know the trouble spots on my routes.
BikeMaps.org is a website where citizens can map cycling crashes, near misses, hazards, or bike thefts.
The data citizens provide to BikeMaps.org will enable researchers and planners to better determine where and when safety is a problem and to monitor changes in safety over time.
Feel free to vent too! In doing so, you will help us fill a massive gap in cycling safety data.
Since the BikeMaps.org website launched in October 2014 we have had over 14,000 visitors and more than 600 mappers in 14 countries.
CRD citizen mappers have contributed 45 per cent of the data to BikeMaps.org so far (Thanks so much!).
The inclusion of near miss data will allow us to be proactive in our planning and will enable more complete monitoring of, for example, how well the new cycling infrastructure planned for the City of Victoria is working out.
Cycling is safe. According to UBC researcher Kay Teschke, cycling fatalities in BC are 13.8 fatalities per 100 million trips, in comparison to 14.7 for pedestrians and 9.6 for cars.
Add in the benefits of reduced risk of all types of chronic disease and it makes you wonder why we don’t ride more.
Concerns about safety, some real and some perceived, are a primary barrier to increased ridership.
The CRD has developed a Pedestrian and Cycling Master Plan with goals of increasing cycling to 15 per cent of trips regionally and 25 per cent in urban areas by 2038.
The CRD’s plan requires dramatic action to increase ridership from a long-term trend near 3 per cent.
Better data will show us where we need to increase safety and some areas where we can be confident we are safest to ride.
The less time I spend in my car in 2015 the happier and healthier I will be.
Safer cycling means I can ride more places with my kids and, in a couple of years, they can ride more places on their own.
You can get involved by sharing your riding experience on BikeMaps.org.
Watch for new results from analysis on twitter @BikeMapsTeam and FaceBook.
By mapping at BikeMaps.org you're adding to a long-term database of cycling data and helping to make cycling safer for everyone.